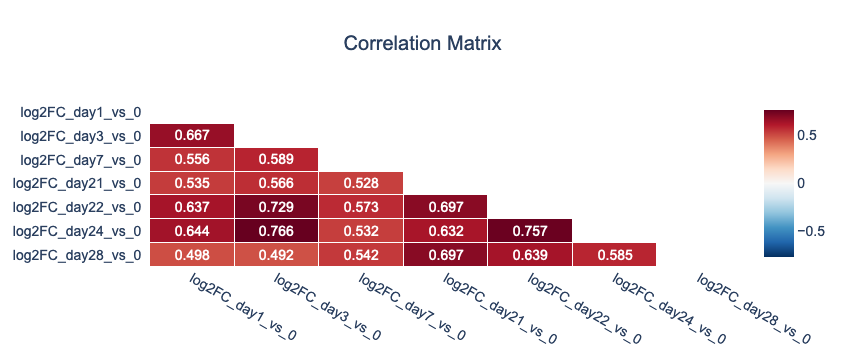
Interactive correlation matrix
Load the required packages
Load your .csv file, assign first column as index (gene names), include the term log2FC for columns that are used for plotting correlation matrix (e.g. log2FC_day7, log2FC_treatment etc.)
Formula for correlation matrix. Correlation coefficients will be determined based on columns with the term "log2FC". All rows with n/a values are removed.
Plot correlation matrix based on df. All columns with "log2FC" terms in the headers will be plotted for correlation matrix. See example on top.